Structure of plots
GRUtils replaces some long, convoluted functions of jlgr with many if-else blocks by more numerous, but smaller functions based on type-dispatch, and takes advantage of meta-programming, such that those functions can be revised and debugged easily, and new utilities can be added with new functions and methods, without having to modify the existing ones.
Plots are composed of a set of objects of different types, which are defined below, along with some notes comparing this structure with the plots produced in jlgr.
Figures
Figures are the "top-level" objects, that contain all the information of a plot or set of "subplots" that are meant to be drawn together. This is represented by the type Figure, which is basically a collection of plots, gathered in a graphic workstation of a given size. Its structure is simple, defined in a very basic constructor:
GRUtils.Figure — TypeFigure(workstation::Tuple{Float64, Float64}, plots::Vector{PlotObject})Return a new figure, defined by:
workstation: aTuple{Float64, Float64}with the width and height of the overall plot container (workstation), in pixels.plots: a vector ofPlotObjectelements, which contain the information of the individual plots included in the figure.
Plot objects
The type PlotObject provides the data structure for what can be considered a "complete" single plot. This type is roughly equivalent to the type of the same name defined in jlgr, although its structure is quite different:
GRUtils.PlotObject — TypePlotObject(viewport, axes, geoms, legend, colorbar, attributes)
PlotObject(viewport, axes, geoms, legend, colorbar; kwargs...)Return a PlotObject containing the following parameters:
viewport: aViewportobject, which defines the area covered by the plot and the coordinate axes in the display.axes: anAxesobject that defines how to represent the coordinate axes of the space where the plot is contained.geoms: aVectorofGeometryobjects that are plotted in the axes.legend: aLegendobject that defines how to present a legend of the different geometries (if required).colorbar: aColorbarobject that defines how to present the guide to the color scale (if required).attributes: a dictionary (Dict{Symbol, Any}) with varied plot attributes, including the title, axis labels, and other data that modify the default way of representing the different components of the plot. Those attributes can be passed to thePlotObjectconstructor as keyword arguments.
All the parameters of a PlotObject are instances of other types for the different elements of a plot, which are defined below. PlotObject is a mutable type, which means that those parameters can be replaced by others of the same type without having to replace the whole object.
The last plot of a figure f is considered itself its "current plot", and can be referred to by the function currentplot(f). If no argument is given to currentplot(), the last plot of the current figure is returned — equivalent to currentplot(gcf()).
In jlgr, the function gcf() directly returns the global current plot, which can also be identified by jlgr.plt.
Viewport
GRUtils.Viewport — TypeViewport(outer::Vector{Float64}, inner::Vector{Float64})Return a Viewport object, defining the "normalized device coordinates" (NDC) of the outer box that contains all the elements of the plot, and the inner box where the main items (axes and geometries) are plotted.
The Viewport of a plot defines the "normalized device coordinates" (NDC) of the outer box that contains all the elements of a plot, and of the inner box where the main items (axes and geometries) are plotted.
Such boxes are defined by 4 coordinates; the first and second coordinates are the distances between the left margin of the device and the left and right borders of the box, respectively; the third and fourth coordinates are the distances between the bottom of the device and the bottom and top borders, respectively.
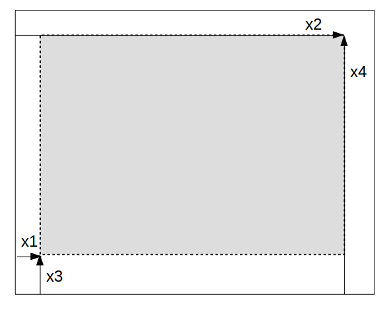
NDC are given in dimensionless units between 0 and 1, such that (0, 1, 0, 1) means a box that spans over the whole device.
In jlgr, the outer and inner boxes of a plot are described in the field kvs of the corresponding PlotObject item. For instance, for the global "current plot" plt, the coordinates of the outer box are plt.kvs[:viewport], and for the inner box they are plt.kvs[:vp].)
Geometries
GRUtils.Geometry — TypeGeometry(kind, x, y, z, c, spec, label, attributes)Return a Geometry containing the data represented in a plot by means of geometric elements (lines, markers, shapes, etc.).
Each Geometry has a kind, given by a Symbol with the name of the geometric element that it represents, such as :line for lines, :scatter for scattered points, :bar for bars, etc. In addition it has the following fields:
x,y,z,c: Vectors ofFloat64numbers that are mapped to different characteristics of the geometry.xandyare normally their X and Y coordinates;zusually is its Z coordinate in 3-D plots, or another aesthetic feature (e.g. the size in scatter plots);cis usually meant to represent the color scale, if it exists.spec: aStringwith the specification of the line style, the type of marker and the color of lines in line plots. (Cf. the defintion of format strings in matplotlib)label: aStringwith the label used to identify the geometry in the plot legend.attributes: aDict{Symbol, Float64}with extra attributes to control how geometries are plotted.
In jlgr, all those data except the ones contained in the field attributes are given in the elements of the args vector of the corresponding PlotObject item.
Axes
GRUtils.Axes — TypeAxes(kind, ranges, tickdata, ticklabels, perspective, camera, options)Return an Axes object, containing the graphical specifications of the coordinate system of a plot.
Axes are determined by their kind, which may be :axes2d for 2-D plots, :axes3d for 3-D plots, and :polar for polar plots. The rest of its fields are:
ranges: boundaries of the different axes/scales. They are given as a dictionary whose keys are symbols with the name of the axis (:x,:y,:z,:c), and whose values are tuples with two float values — the minimum and maximum values, respectively. The range(Inf, -Inf)describes an undefined axis.tickdata: numeric specifications of the "ticks" that are drawn on the axes. They are given as a dictionary whose keys are the names of the axis (as forrange), and whose values are tuples that contain for that axis: (1) aFloat64with the "minor" value between consecutive ticks; (2) a 2-tuple ofFloat64with the ends of the axis ticks; and (3) anIntwith the number of minor ticks between "major", numbered ticks.ticklabels: transformations between tick values and labels. They are given as a dictionary whose keys are the names of the axis, and whose values are functions that accept a number as argument, and return a string with the text that must be written at major ticks. (This only works for the X and Y axes).perspective: AVector{Int}that contains the "rotation" and "tilt" angles that are used to project 3-D axes on the plot plane. (Only for 3-D plots)camera: AVector{Float64}with the camera parameters (camera position, view center and "up" vector, only used for 3-D plots).options: ADict{Symbol, Int}with extra options that control the visualization of the axes. Currently supported options are:options[:scale], an integer code that defines what axes are must be plotted in log scale or reversed (cf. the functionGR.setscale).options[:grid] = 0to hide the plot grid, or any other value to show it.options[:tickdir]to determine how the ticks are drawn (positive value to draw them inside the plot area, negative value to draw them outside, or0to hide them).options[:render3d]: an integer code that indicates how 3-D scenes are rendered: (0for "classic" 3-D layout,1for post-GR 0.58 3-D layouts,3for GR3 scenes)options[:radians] = 0to transform angular values to degrees in polar axes.
In jlgr, most of those data are described in the dictionary kvs contained in the corresponding PlotObject item, or calculated during plotting operations without being stored.
Legends
GRUtils.Legend — TypeLegend(size::Tuple{Float64, Float64}, cursors::Vector{Tuple{Float64, Float64}})Return a Legend object.
This type defines the frame where a legend is plotted. The fields contained in a Legend object are a 2-tuple with the size of the legend box in NDC (width and height, respectively), and a vector of 2-tuples with the positions of the legend items.
The symbols and labels that should be shown in the legend are not described in the Legend object, but they are fetched from the Geometry objects used in the plot where the legend is defined.
In jlgr, those values are not stored in any parameter of plot objects. Only the relative position of the legend with respect to the axes area is stored, and everything is calculated in the moment of drawing the plot.)
Color bars
GRUtils.Colorbar — TypeColorbar(range, tick, scale, margin, colors)Return a Colorbar object containing the data that defines the colorbar associated to a plot.
The fields contained in a Legend object are:
range: a Tuple{Float64, Float64} with the range of the color scale represented in the bar.tick: aFloat64that gives the distance between tick marks drawn as guide next to the bar.scale: anIntcode used byGR.setscaleto define the scale of the bar (basically, if it is presented as linear or log scale).margin: aFloat64with the size of the extra margin between the main plot frame and the bar.colors: anIntindicating the number of different grades in the color scale.
In jlgr, those values are not stored in any parameter of plot objects, and everything is calculated in the moment of drawing the plot, if suitable.